
Click here for the Latest Results
In this phase of the project, the aim was to implement a platform for territorial analysis using satellite images, to monitor the temporal evolution of soil covers in the study area. The purpose is to provide an easily accessible tool for public consultation and that provides updated information on the state of the territory. This information could be used both for environmental conservation purposes and for the analysis of available water resources and crop monitoring (precision agriculture).
Constantly updating satellite image databases (e.g. Google Earth Engine) were used to develop an automated environmental monitoring system. The system allows that, as new satellite images (in accordance with the image acquisition plans by the observation platforms) and of adequate quality become available (i.e., without cloud cover, without spurious pixels, etc.), proceed in an automated manner to calculate various parameters of interest for monitoring the environmental state of vegetation and soils.
The images used for this process are acquired by the Sentinel 2 satellites (Figure 13) of the European Space Agency (www.esa.int). It is made up of a constellation of two identical satellites in the same orbit, separated by 180 degrees, to achieve joint territory coverage every five days. They have a multispectral sensor called Multispectral Imager (MSI), with 13 spectral bands strategically arranged in the visible, near infrared and shortwave infrared spectral ranges. In addition, the bands have different spatial resolutions (10, 20 and 60 meters), providing of the maximum resolution four bands in the VNIR range. The missions have been operational since June 2015, the first of them, and since March 2017, the constellation of two satellites.
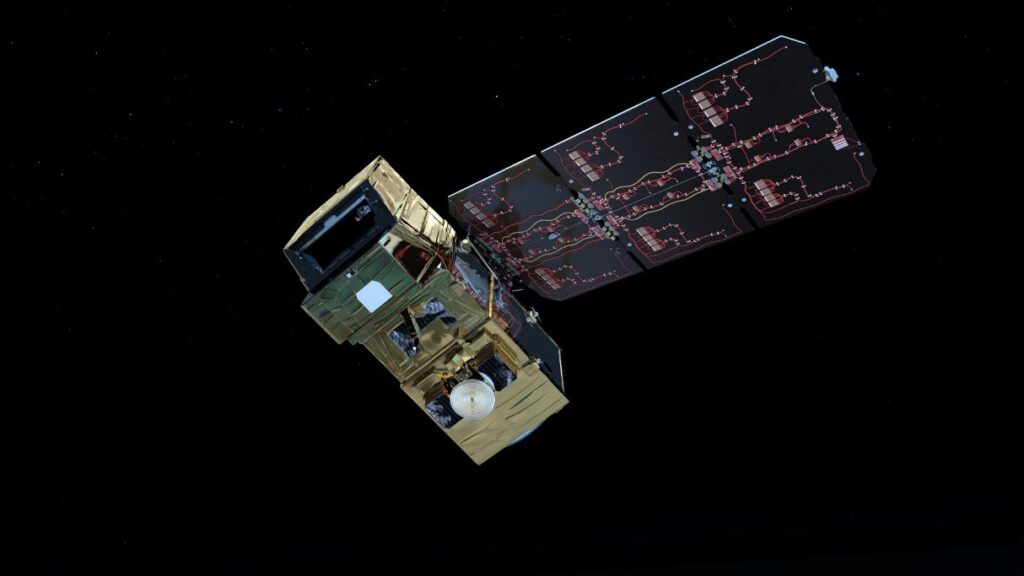
Recreation in orbit of a Sentinel 2 satellite. Source: European Space Agency (ESA).
In this phase of the work, the calculation of three very useful spectral indices for monitoring natural resources and crop monitoring has been implemented in an automated manner. The indices whose automated calculation has been implemented are the following:
Normalized Difference Vegetation Index (NDVI)
The Normalized Difference Vegetation Index (Rouse, Haas, Schell & Deering, 1973) is a spectral index for vegetation, which allows the standardized calculation of an image (values between -1 and + 1), for the estimation of the greenness of the vegetation (relative biomass). This index, which is perhaps the most used throughout the history of remote sensing, allows enhancing the contrast of reflectance for healthy vegetation, between the low reflectance for a band in the red spectral range due to absorptions by the pigments. of chlorophylls, and a high reflectivity by the leaf tissues for a band in the near infrared (see spectrum of the lemon tree in Figure 5). This index is calculated with spectral bands of 10 meters spatial resolution and whose formulation adapted to the bands (B) of the Sentinel 2 satellite sensors is as follows.
![\[ NDVI = \frac{B8-B4}{B8+B4}\]](https://www.meren.es/wp-content/ql-cache/quicklatex.com-526a25e343ddef1522080ef0ebbf2101_l3.png "Rendered by QuickLaTeX.com")
Normalized Difference Moisture Index (NDMI)
The Normalized Difference Moisture Index (Horler & Ahern, 1985) is a spectral index for vegetation, which allows the standardized calculation of an image (values between -1 and +1), for the estimation of the moisture content of the vegetation. It uses the difference in reflectance in vegetation not subject to water stress, between near infrared (about 850 nm) and shortwave infrared (about 1650 nm). It is an index that, together with the NDVI, provides very valuable information for monitoring natural covers and their response to environmental changes, such as the effects of drought on crops or forest masses, the analysis of phenological cycles. of crops and their harvest estimation, the impact of plant pests on crops, etc. This index is calculated with spectral bands of 20 meters of spatial resolution and whose formulation adapted to the bands (B) of the Sentinel 2 satellite sensors is as follows.
![\[ NDMI = \frac{B8a-B11}{B8a+B11}\]](https://www.meren.es/wp-content/ql-cache/quicklatex.com-12e2ff16b0602d18107211101080c3ab_l3.png "Rendered by QuickLaTeX.com")
Normalized Difference Built-up Index (NDBI)
The Normalized Difference Built-up Index (Zha, Gao & Ni, 2003) is a spectral index used to analyze urbanized and sealed soil areas. It makes use of the general pattern for artificial surfaces (see differences between the characteristic spectra shown in Figure 6), of increasing reflectance as the wavelength increases from the near infrared to the shortwave infrared. This index is calculated with spectral bands of 20 meters of spatial resolution and whose formulation adapted to the bands (B) of the Sentinel 2 satellite sensors is as follows.
![\[ NDBI = \frac{B12-B8a}{B12+B8a}\]](https://www.meren.es/wp-content/ql-cache/quicklatex.com-27a2b6a4e5ac2a4a3f9a7fb114aa105c_l3.png "Rendered by QuickLaTeX.com")
As an example, the next figure shows a calculation of the spectral indices described above. As can be seen in the image focused on the surroundings of the town of San Miguel de Salinas, the irrigated crop fields have higher NDVI values, evidenced by a lighter gray. This image is largely in contrast to the NDBI, which highlights urban areas and stark soils with lighter colors. For its part, the NDMI highlights the presence of bodies of water, whose geometry and surface are perfectly evaluable (it would also serve to calculate the volume of water stored).
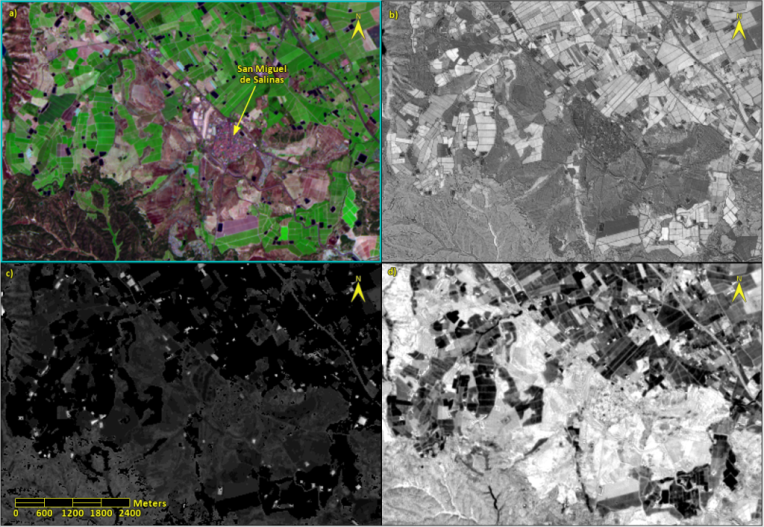
Spectral indices used in the automated territorial monitoring system:
a) false color composition R.G.B: 12.8a.4; b) NDVI; c) NDMI; and d) NDBI.
The final result of this work phase is a public consultation system (available at https://www.meren.es/vis-aims/) of these environmental variables, which will be calculated as new images become available, and which provides valuable information to analyze the environmental changes that have occurred in the territory under study. This system is expandable, both with new calculation procedures and with the possibility of extending this application for other administrative entities (municipalities, provinces, etc.) and specific uses (precision agriculture, water resource management, etc.).
References
- Horler, D. N. H. y F. J. Ahern (1985): «Forestry information content of Thematic Mapper data», International Journal of Remote Sensing, 7/3, pp. 405-428.
- Rouse, J. W., R. H. Haas, J. A. Schell y D. W. Deering (1973): «Monitoring Vegetation Systems in the Great Plains with ERTS (Earth Resources Technology Satellite)», En Proceedings of 3rd Earth Resources Technology Satellite Symposium. 10-14 December, Greenbelt 8MD), USA, SP-351, pp. 309-317.
- Zha, Y., J. Gao y S. Ni (2003): «Use of normalized difference built-up index in automatically mapping urban areas from TM imagery», International Journal of Remote Sensing, 24, pp. 583-594.